
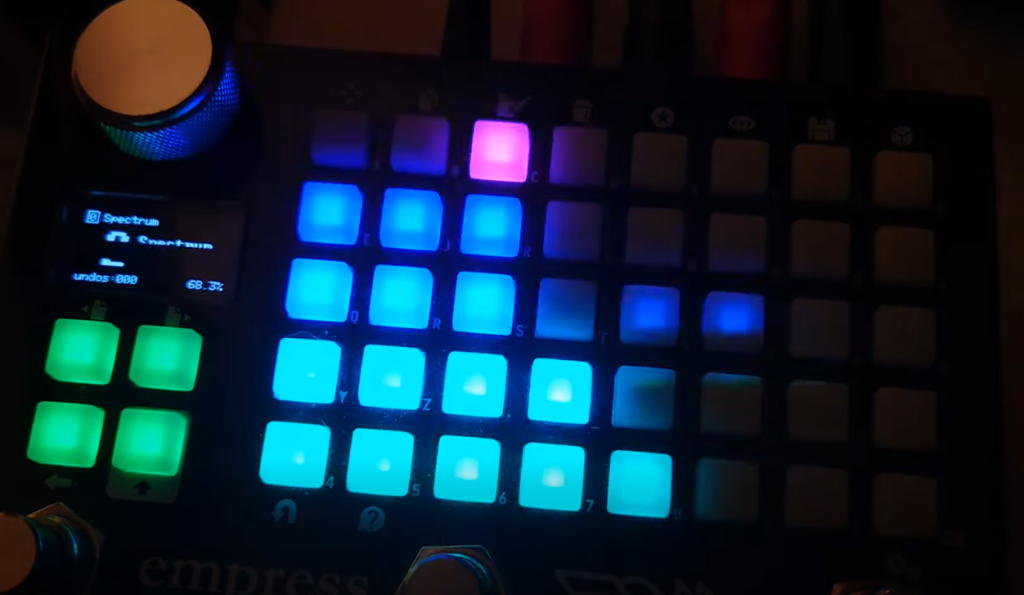
An 8-band spectrum analyzer with controls for sensitivity, band Q, rise, and fall that affect all bands simultaneously. Not calibrated to scientific standards. Audio is unprocessed. Makes for a nice visualizer when the Zoia might otherwise be bypassed.
Pages:
0. Spectrum Visual Output
1. Input and Control (with three value modules labeled “Q”, “Rise”, and “Fall” in the bottom left and a “Sensitivity” VCA module, allowing the user to set the incoming volume so the spectrum output is calibrated properly. There’s also an expression input, not currently linked, but I was using it to set the sensitivity via exp input).
2-9. Individual band calcs, all linking back to page 0.
